The insight you need is
 already in your data

Data is only valuable when it's understood. We transform raw data into clear analytical insight, predictive models, and decision-ready dashboards that turn information into commercial advantage.
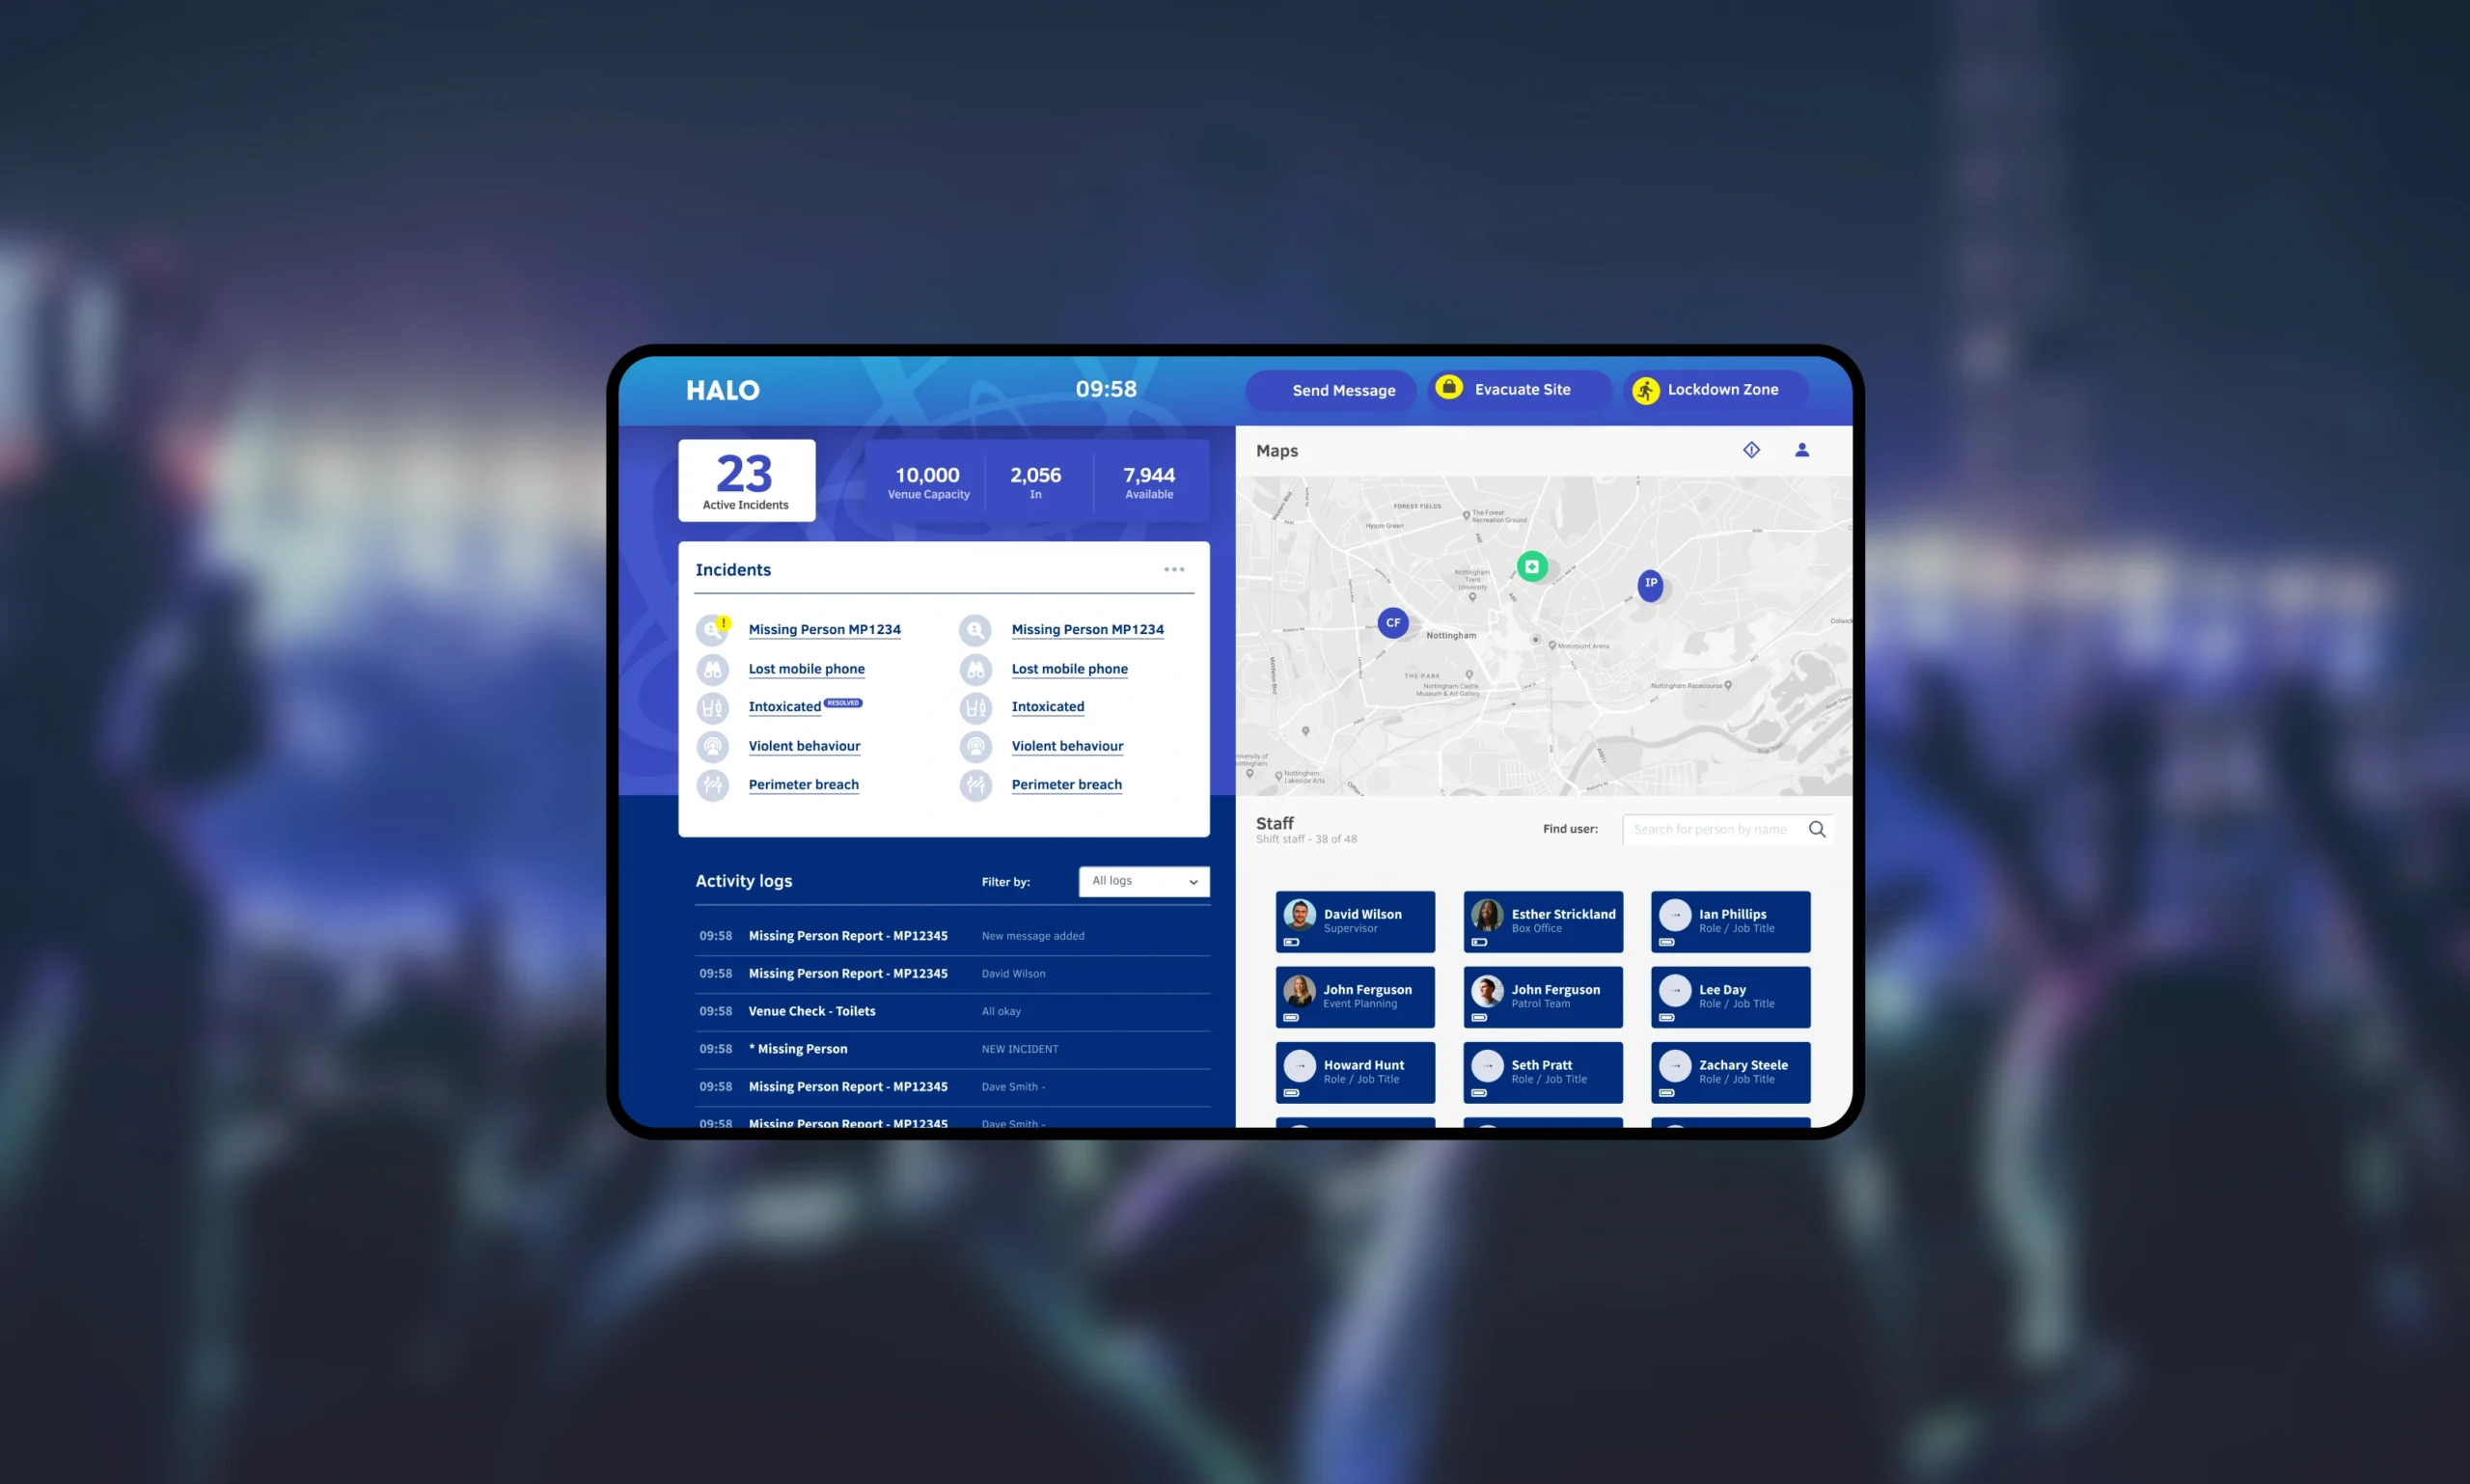
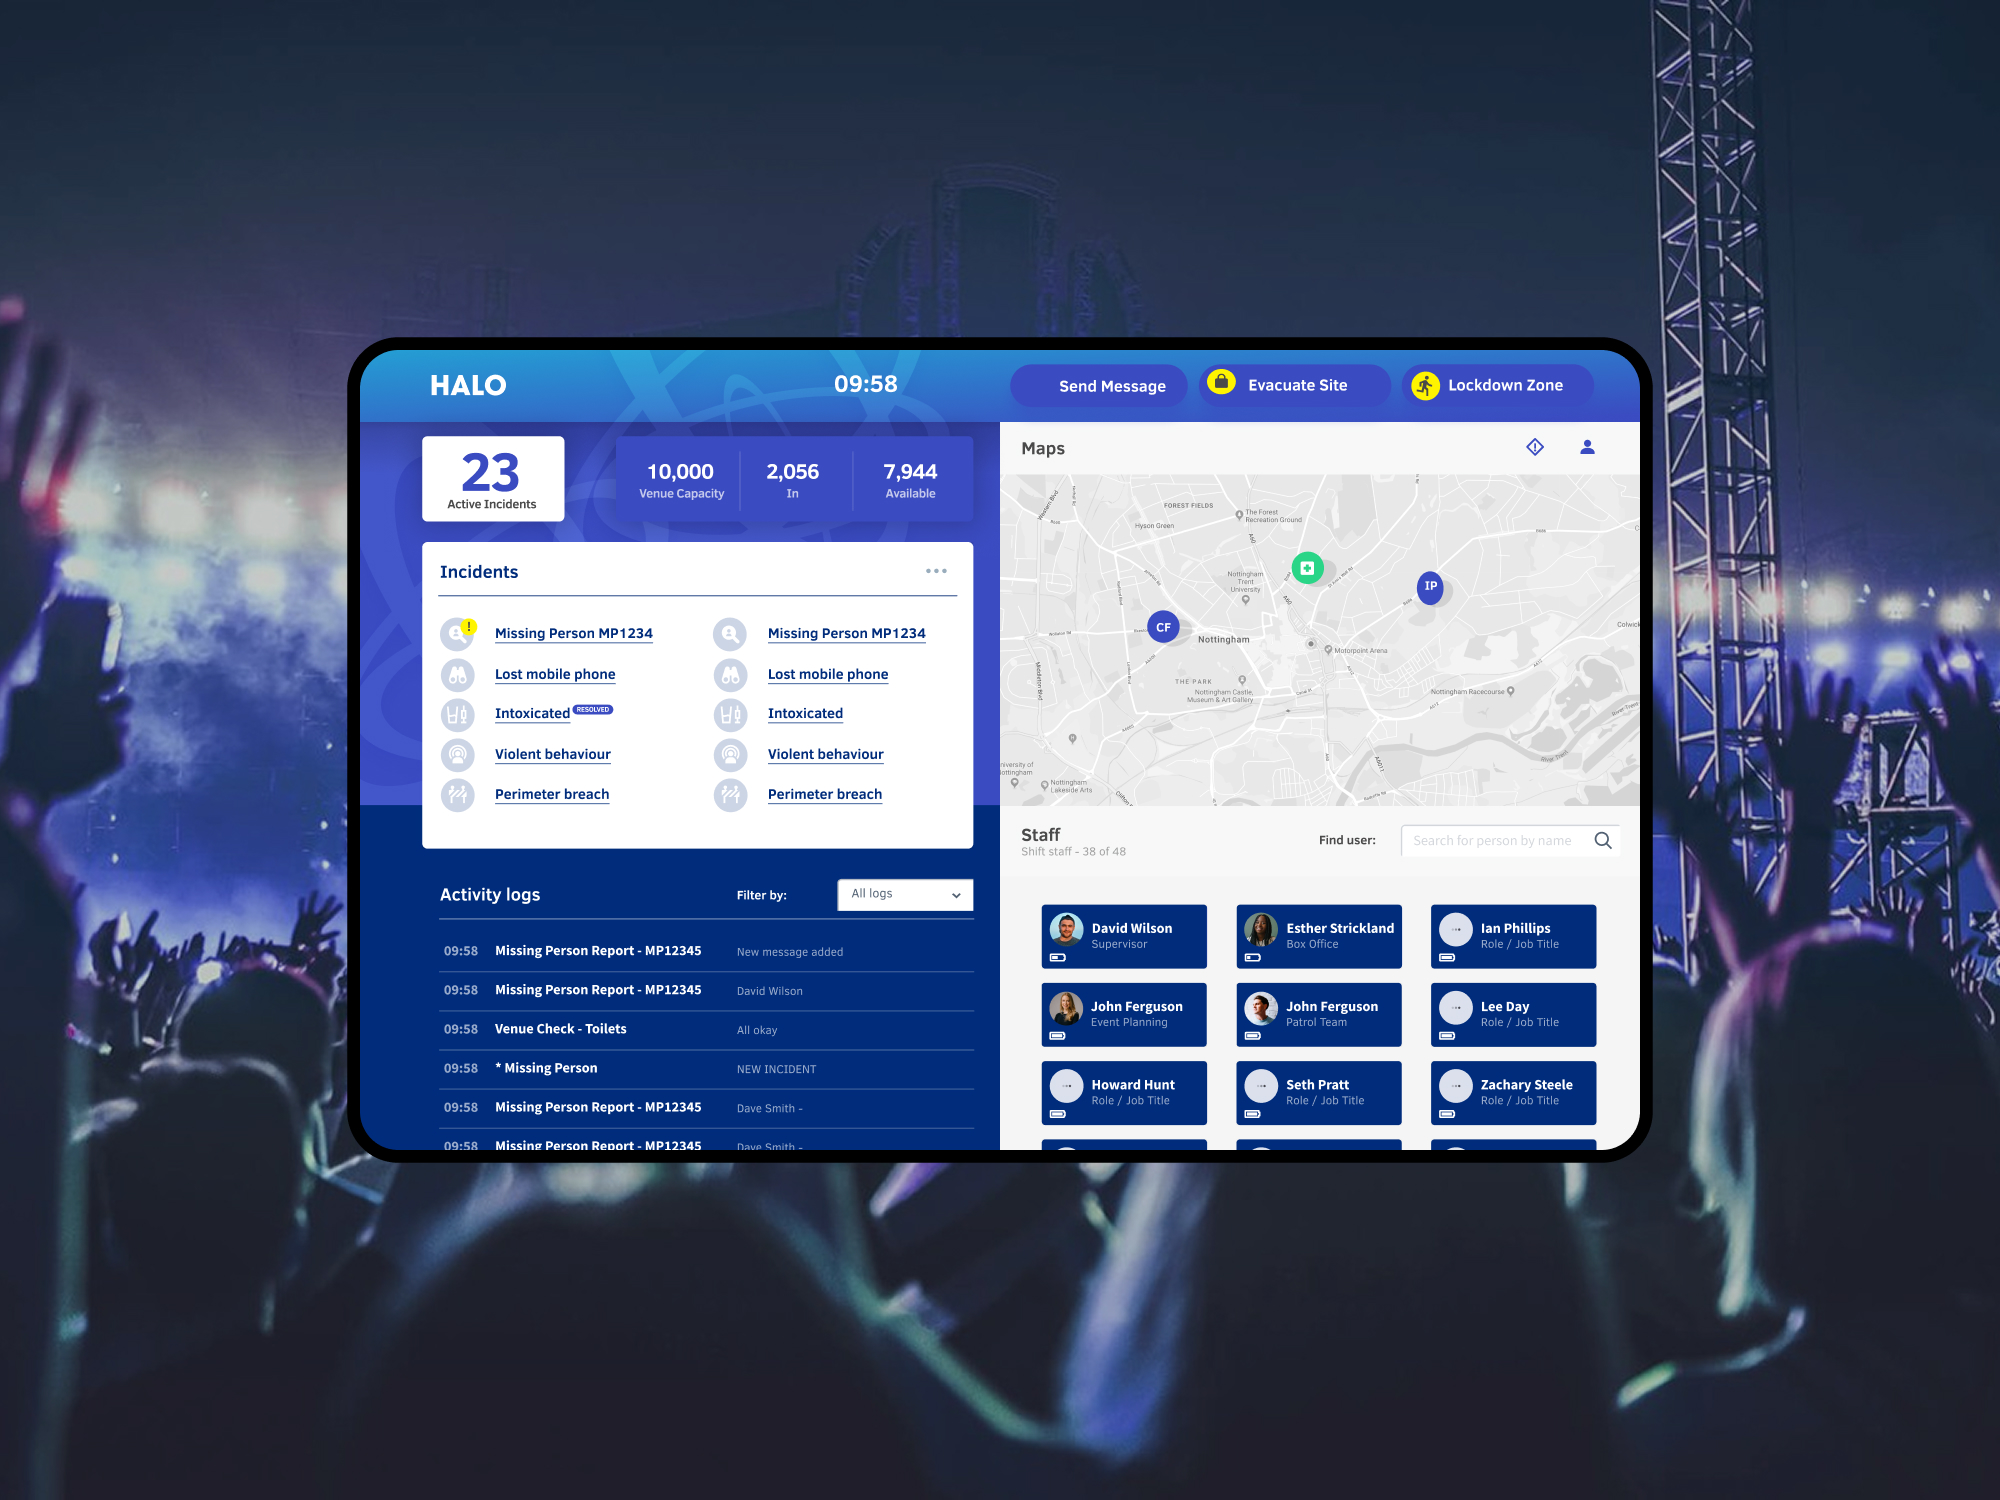
A digital dashboard displays incident and activity logs, a map with markers, staff details, and statistics such as messages sent and subscribers, with a blue-themed user interface.

Most businesses sit on more data than they use

We turn your data 
into better business decisions

We combine statistical rigour and commercial thinking to build the analytical foundations your business needs. From infrastructure to predictive modelling and executive dashboards, we work at every layer of the data stack.

Our data science service capability

We take a rigour-first approach to data science, working with your teams to build the analytical infrastructure and insight tools that turn your data into a genuine competitive asset.
A simple blue outline of a shield with a tick in the center on a white background.

Data strategy & governance

We define how your organisation manages data, with the governance and quality standards that keep outputs trustworthy.

Data engineering & pipelines

We build the pipelines and transformation layers that make raw data clean, available, and structured for analysis.
A blue magnifying glass icon on a white background, commonly used to represent the search function.

Exploratory data analysis

We analyse your data's structure, quality, and characteristics, surfacing patterns and opportunities hidden within.
A simple blue bar chart icon with three vertical bars of varying heights, displayed on a white background.

Statistical modelling

We apply the right statistical methods to your data to answer the specific business questions that matter most.
A simple blue upward-trending line graph icon with an arrow pointing to the upper right, symbolizing growth or increase.

Predictive analytics

We build predictive models that forecast the outcomes your business needs to anticipate: churn, demand, risk, and revenue.
A blue icon with four rounded rectangles arranged in a 2x2 grid, with the top left and bottom right shapes oriented vertically, and the top right and bottom left shapes oriented horizontally.

Data visualisation & dashboards

We build dashboards that make analytical insight accessible to decision-makers in formats that drive action.
A simple blue outline of a speedometer, shown as a circle and line, resembling metrics.

Business intelligence

We implement BI platforms that give your teams self-service access to the data they need to do their jobs.
A simple icon with two blue circles connected by curved blue lines, forming a branching structure on a white background.

A/B testing & experimentation

We design and analyse experiments that give statistically reliable answers to your product and marketing questions.
A blue outline icon of a pie chart with one segment separated, representing data analysis or statistics.

Customer segmentation

We identify distinct customer segments, giving product and marketing teams the precision to serve each group effectively.
A blue outline of a light bulb with two short blue horizontal lines below it, resembling a minimalist icon or symbol for ideas or creativity.

Data science consultancy

Expert guidance on your data strategy, analytical approach, or team capability without a full-scale engagement.

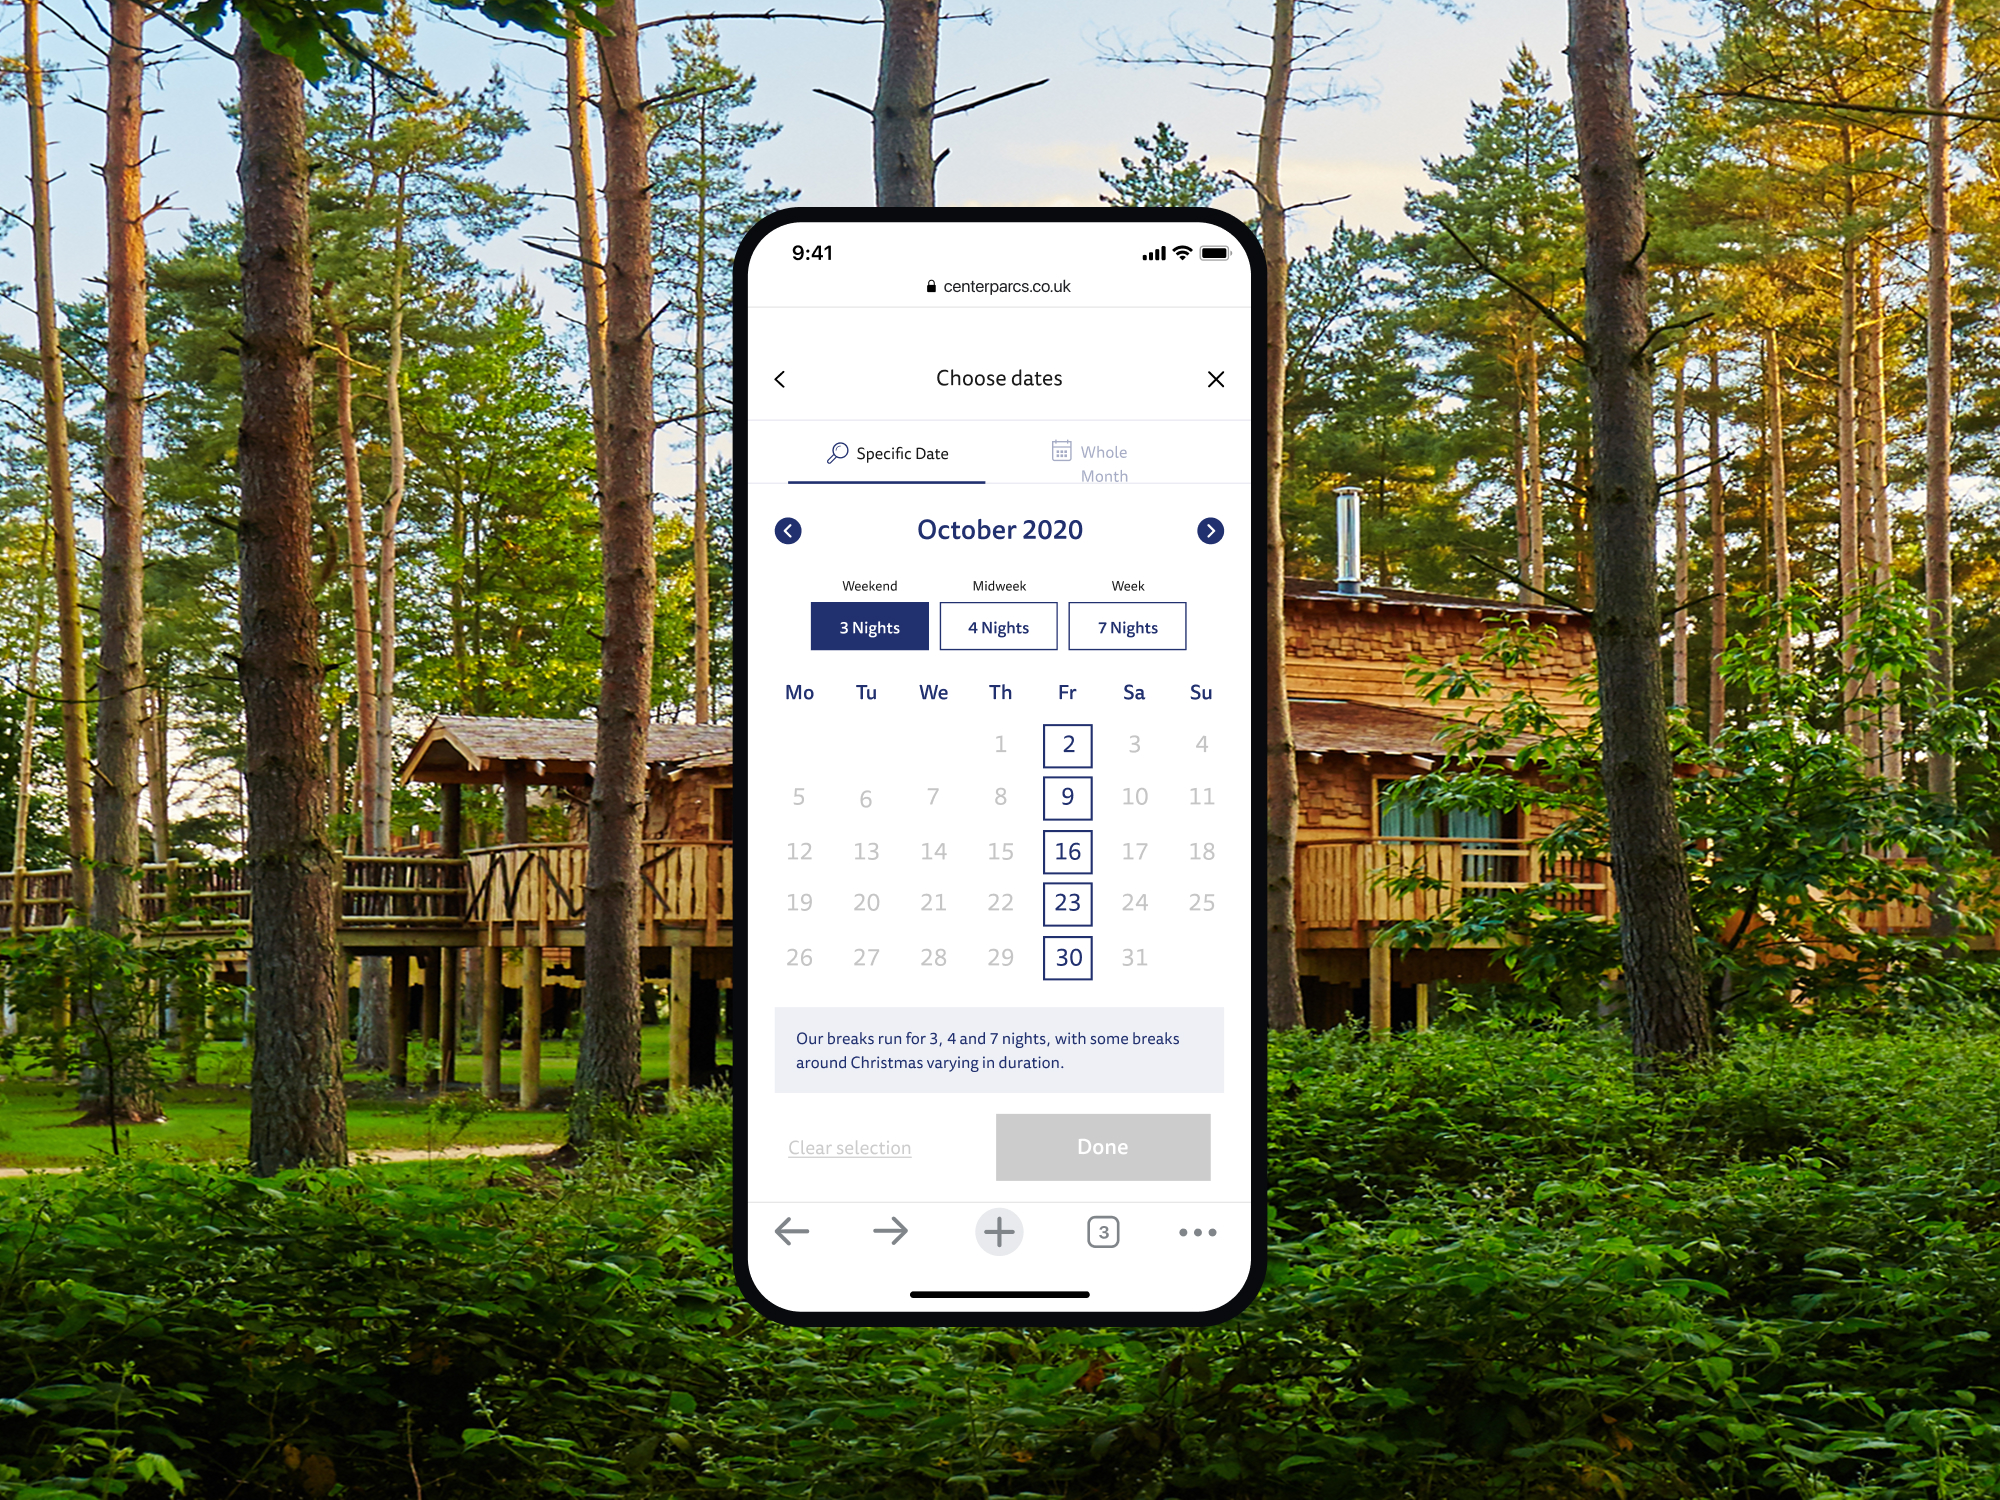
Our partnership with Atomic has been essential in delivering a new level of digital convenience for our guests. The app enriches each stage of their short break, aligning perfectly with our commitment to offering the best possible guest experience.

We succeed together.

Our data science approach is built on one thing: Insight that changes decisions, not just dashboards that look impressive

A blue check mark inside a blue circle on a white background.

Bad data produces confident mistakes

Before any analysis begins, we assess, clean, and validate the data, ensuring every insight and every model is built on a foundation you can trust.
A blue outline of a light bulb with two short blue horizontal lines below it, resembling a minimalist icon or symbol for ideas or creativity.

Reports nobody reads have failed

We design every deliverable around the decision it needs to inform. That's what separates insight that changes behaviour from data that collects dust.
A blue icon with four rounded rectangles arranged in a 2x2 grid, with the top left and bottom right shapes oriented vertically, and the top right and bottom left shapes oriented horizontally.

Great analysis needs to be usable

We build the tools that make data science outputs accessible. Self-service dashboards and decision-support tools in the hands of your business teams.

We turn raw data 
into decision-ready insight

Atomic's data science team works with ambitious brands to build the analytical infrastructure, models, and insight tools that turn raw data into the decision-ready understanding your business needs to grow faster and smarter.

Got questions about data science? We've got answers.

Get in touch

Data science uses statistical analysis, machine learning, and data engineering to extract insight and build predictive capability from complex datasets, helping businesses make better decisions.

Business intelligence reports on what has happened. Data science predicts what will happen and identifies patterns in data that aren't visible through standard reporting and dashboards alone.

It depends on the question you're trying to answer. We begin by understanding your business problem, then assess whether the data you have is sufficient or needs to be collected.

We build data quality checks into every project, profiling your data at the start, identifying gaps and anomalies, and putting validation processes in place before any modelling begins.

A focused data science project typically takes six to twelve weeks from problem definition through to model validation and delivery. Complex programmes with multiple use cases run longer.

Data science investment varies by project complexity, data volume, and the number of models required. We scope every project individually and give a clear estimate after understanding your goals.

We work with Python, R, SQL, and leading cloud ML platforms including AWS SageMaker, Google Vertex AI, and Azure ML. We match our tools to your infrastructure and team environment.

Through clear dashboards, plain-language reporting, and output formats your business teams can actually use. We design every output for the person making the decision, not the data team.

A clear business question, access to your data sources, and an understanding of your data infrastructure. We'll assess what we have to work with and scope the engagement from there.

Yes. We work with your existing data stack, whether that's a cloud data warehouse, on-premise systems, or a mix of both. We integrate rather than replace what you already have.

Explore our related services

API development

Integrations your systems can depend on

We design and build robust APIs that connect your platforms, products, and third-party services, engineered for security, scalability, and long-term reliability.

Web development

Platforms built to perform and grow

We build fast, accessible, and secure web platforms using modern technologies, designed to scale with your business and stay reliable over time.

App development

Apps that earn their place on the home screen

We build native and cross-platform iOS and Android apps that perform brilliantly, from initial design through to App Store submission and post-launch support.

Latest from Atomic